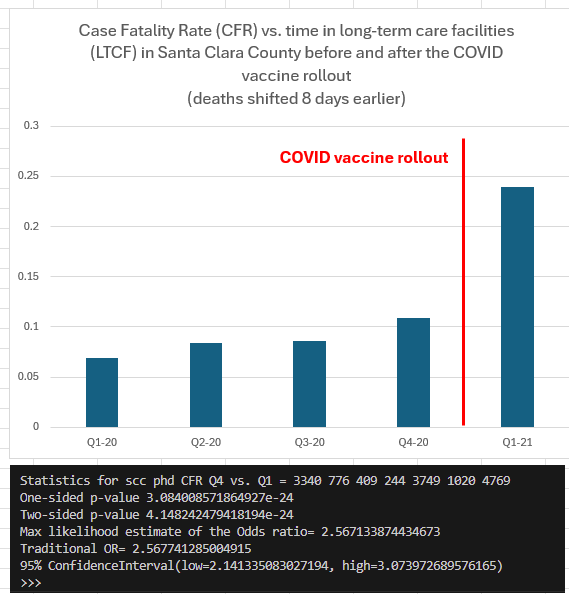
COVID case fatality rate (CFR) increased by 2.6X after they rolled out the jabs in Santa Clara County in 2021
I've asked the Santa Clara County health department to explain why we shouldn't be concerned. They ignored my question as usual.
Executive Summary
Santa Clara County has an excellent open data portal with lots of COVID data posted.
This morning I decided to take a deep dive and I downloaded the long term care facility (LTCF) cases and deaths.
I discovered that after the COVID vaccine rollout began, the COVID case fatality rate more than doubled from rates prior to the vaccine rollout. The result was statistically significant.
I asked Ben at US Mortality to double check my work. His results are posted below.
The shots were supposed to make the elderly less likely to die from COVID, not more likely to die from COVID.
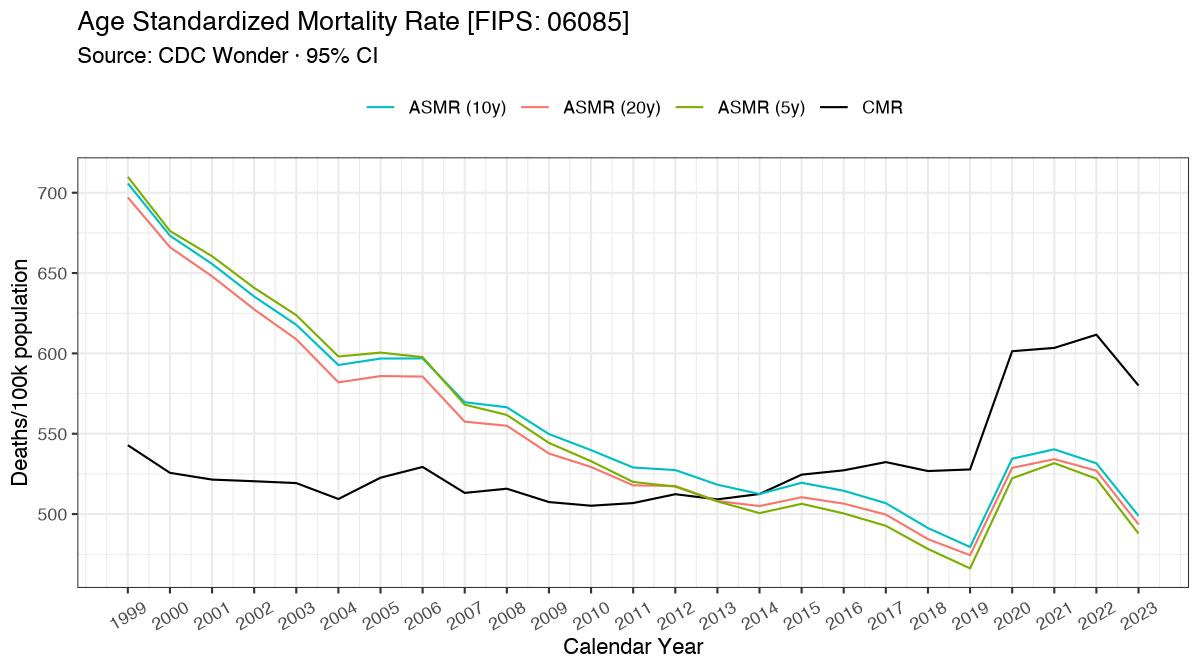
Furthermore, the age-standardized mortality rate (ASMR) in Santa Clara County didn’t return to normal after the mask mandates, lockdowns, and a stunning 95% vaccination rate in the County. As Ben noted, the ASMR increased in 2021 vs. the 2020 baseline, and 2022 was only slightly lower.
I’ve reached out to media relations at the public health department (PHD) for an explanation as to why we shouldn’t be concerned about these numbers. I will update this article with their response when I hear back.
The data so you can replicate my work
My work is all posted on my Github in the covid repo. The README explains the details. The latest analysis is in the version 2 excel file.
You can download the public health data for long term care facilities (LTCF) cases and deaths.
The increase was large and statistically significant. The variant didn’t change.
The PHD declined to comment. So I’ll publish this in the peer-reviewed literature.
When I posted the result on X, here was one of the first comments I received, but the commenter was referring to the all-cause mortality rate whereas my post was specific to COVID cases and COVID deaths:
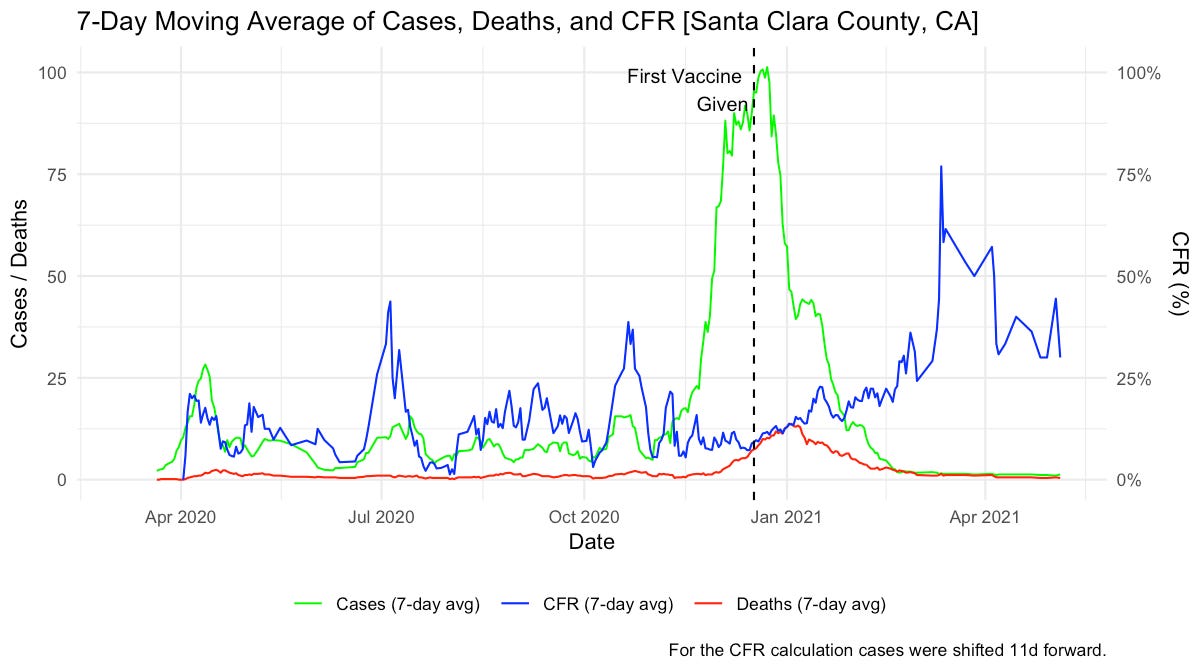
Ben at US Mortality posted this analysis
You can see his code and the graphs here. I’ve reproduced the final graph below.
See how the CFR (blue line) which was flat before the vaccine rollout starts climbing up after the dashed vertical line (vaccine rollout)? It’s supposed to be going down, not up!


Questions sent the public health department
Was the PHD aware of this issue in 2021? Were there any reports or analysis done to explain why this isn’t a problem? The data is basically opposite what we were expecting.
Was there any internal discussion about warning the public about it?
The prima facie conclusion is that the COVID vaccine caused the CFR to jump since this is a massive instant shift and there were no policy changes. If this isn’t the correct explanation, what is the correct explanation and how can the PHD be so confident that it was NOT caused by the vaccine?
My hypothesis: the COVID vax made the CFR worse.
Here’s my reasoning:
The US Nursing home data showed that the CFR increased after the COVID shots rolled out. See this article for details and graphs. The CFR graph in this article is even more stunning.
The full US data (from OWID) showed the CFR increased after the shots rolled out. See this article for details and the CFR graph.
An analysis of the UK data nursing home data recently published in the peer-reviewed literature showed that there might be a tiny benefit (they had to use AI to find it and it was present in just 2 of the 3 indicators so it’s not certain if it was a real signal), but for boosters the effect turned harmful after just 3 weeks.
We have a plausible mechanism of action: the vaccine suppresses your immune system.
The verified anecdotes we have would simply be impossible to explain if the COVID vaccine isn’t killing people. Please read this article about the stunning stats at Apple Valley Village.
I have been unable to find a single success anecdote. None of the nursing homes I contacted returned my calls and my requests on X for a success story have all met with silence (or personal attacks for asking the question).
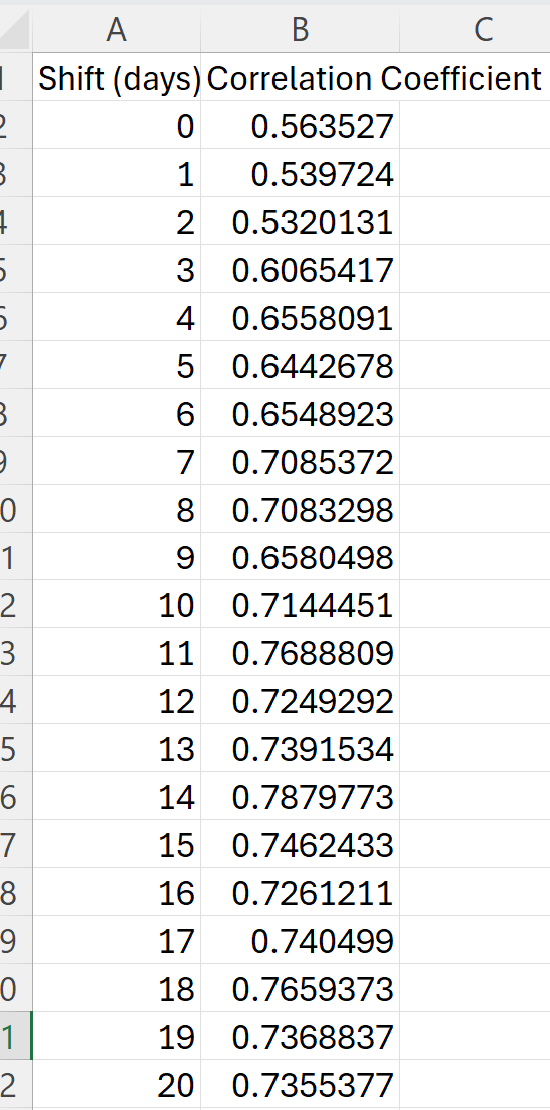
Other assumptions yield similar results
The correlation coefficient between cases and deaths for time shifts are as follows:
The peak is at 14 days. If you do the calculation of Dec vs. Jan you get an OR=.75 (meaning the IFR was lower in December by 25% which shouldn’t happen) and a p value of .0098 which means this was unlikely to just happen by chance. December CFR is 13.04%. For January 2021, the CFR is 16.61%.
What do you think caused the increase in CFR in Santa Clara County after the COVID shots rolled out?
It wasn’t the COVID variant because the original strain was dominant for most all of the observation period.
Summary
I’ve reached out to the SCC PHD for comment.
I look forward to hearing their response and will update this article when I hear back.


I've long argued that ignorance is a very dangerous attribute, and a 95% injection rate for Santa Clara indicates that ignorance is in full flower in that county. For me the big story coming out of the covid era is the stunning level of ignorance manifested by a large percentage of the population. Masks. Simple research reveals that even the best of them have 0.3 micron holes while viruses measure 0.1 microns. So wearing masks is like trying to catch mosquitoes using a barbed wire fence! Do people know things like this? No. They do not. Why don't they know? Mostly because they are gullible and lazy - too lazy to do a bit of basic research - and those things have cost lives. As I said, ignorance is a very dangerous thing. It can kill you.
Accountability must happen and the Santa Clara County Health Department must be first to face justice.