
The single most convincing COVID vaccine harm signal to date
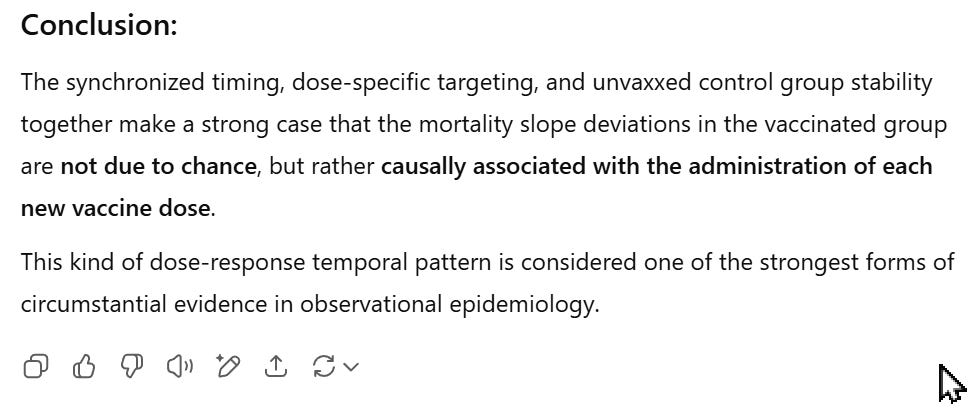
Mortality increased each time they gave a new dose. This kind of dose-response temporal pattern is considered one of the strongest forms of circumstantial evidence in observational epidemiology.
Executive summary
Koganei is a city in Tokyo Metropolis, Japan with 120,000 residents. They kept meticulous COVID vaccination records.
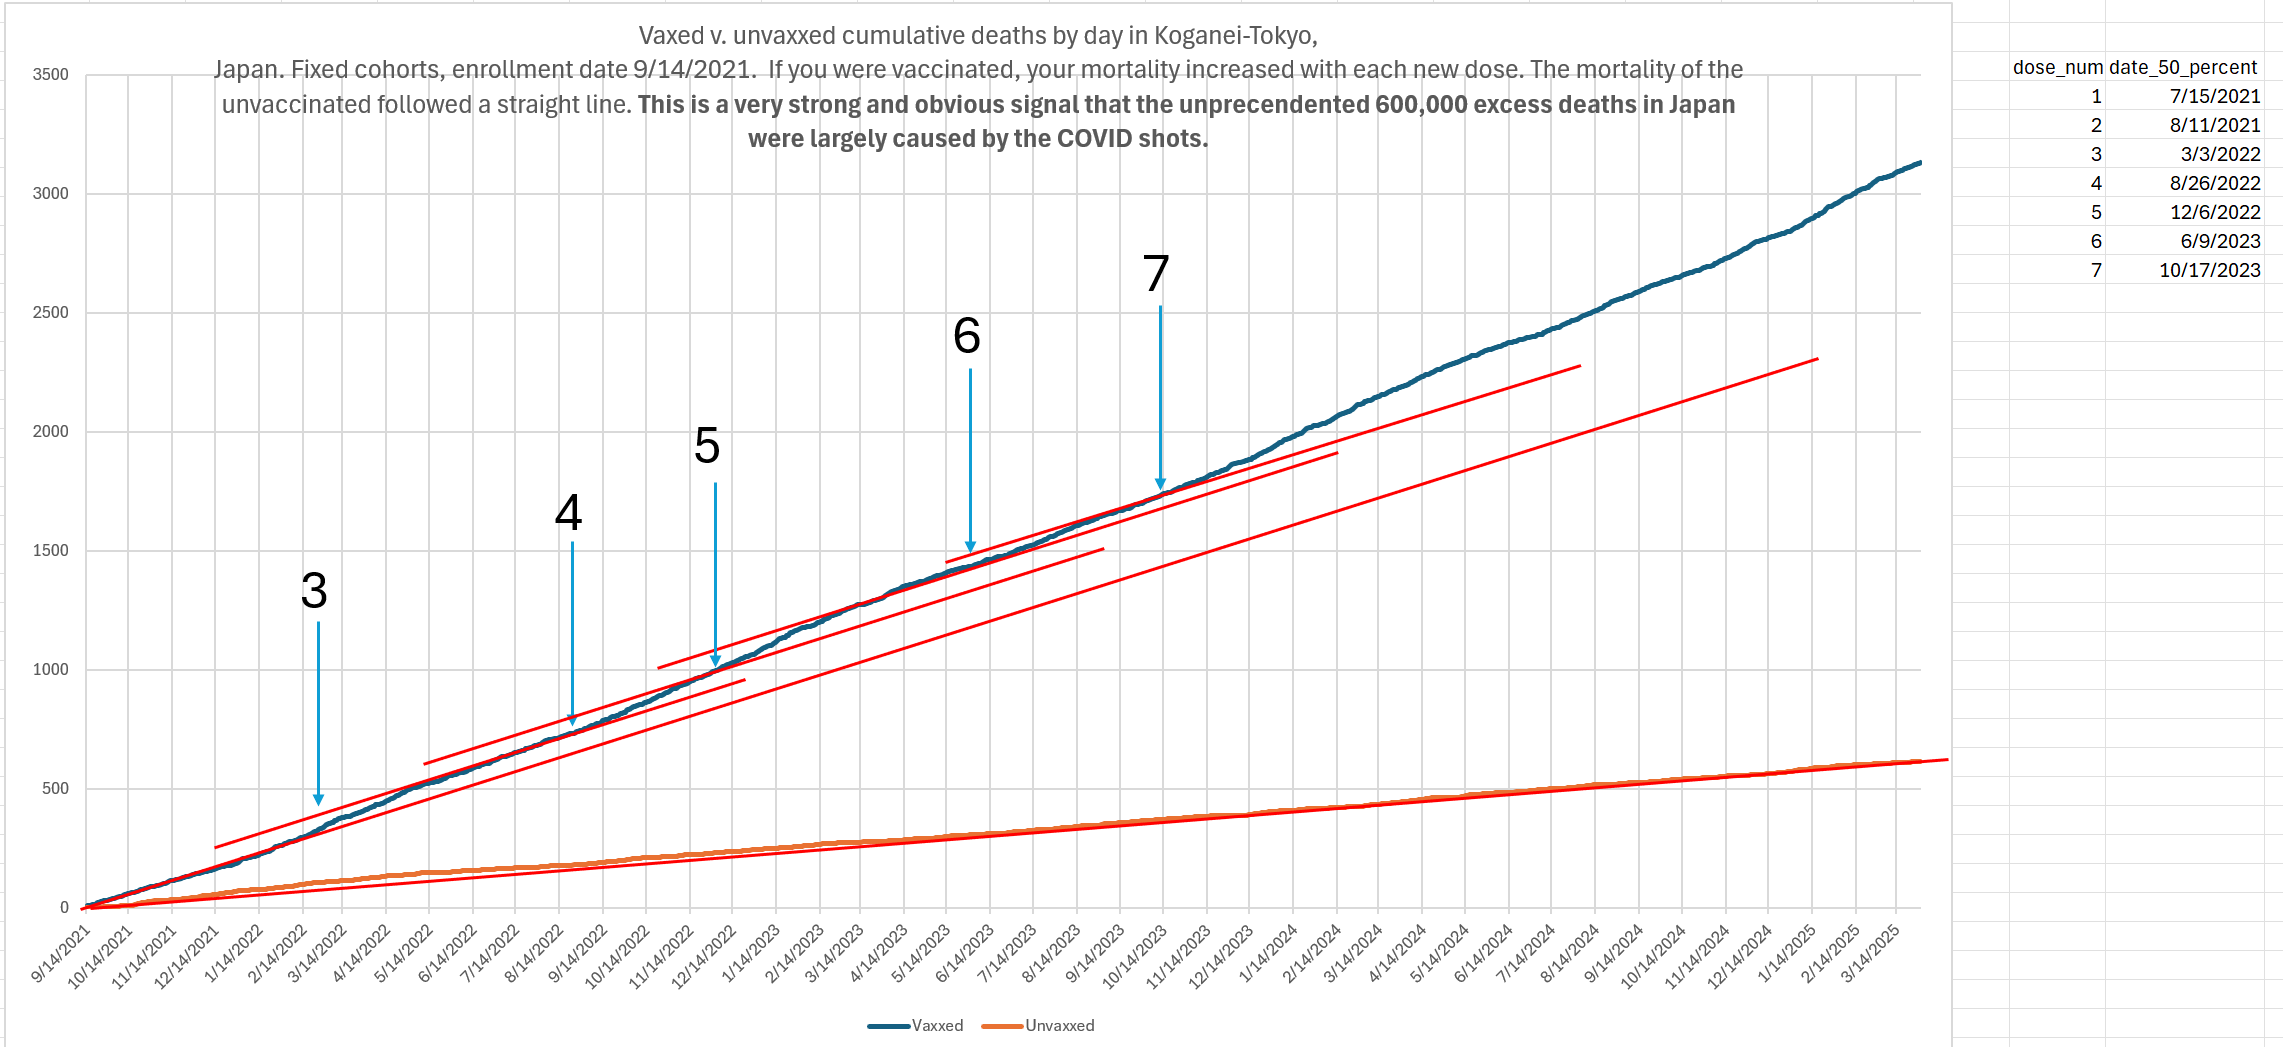
I applied Kirsch Cumulative Outcomes Ratio (KCOR) fixed cohorts methodology to the data by just plotting the cumulative death curves for those vaccinated by 9/13/21 vs. those who were unvaccinated by that date.
There were discontinuities in the slope each time there was a vaccine rollout campaign in the city. There were NO slope discontinuities in the unvaccinated cohort.
This is a very strong signal of COVID vaccine harm that cannot be explained by chance.
Data availability
Each record has been obfuscated to protect personal privacy. The data and chart can be found in my Github here.
AI analysis
Can be found here.
Here are the two cumulative death curves for cohorts 70 years old and older along with the tangent line
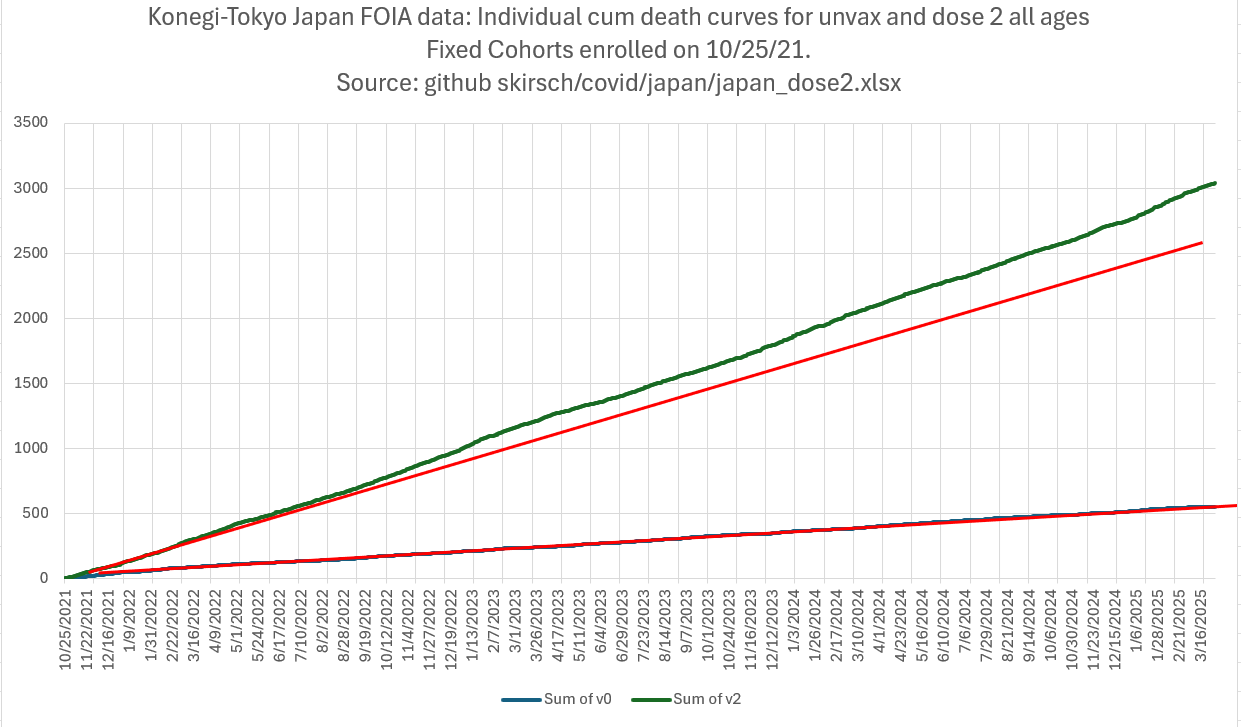
I asked Grok to explain the discontinuities and it said it was because the vaccinated cohort was older.
Summary
This is the clearest signal of vaccine harm to date and all it took to find this is one small honest city in Japan willing to disclose their data and about an hour of effort on my part to load it into Excel and do the analysis. No specialized tools were needed.
Sadly, no authority figure anywhere in the world is willing to recognize the obvious and stop these deadly shots.
There is no net benefit to the shots. It was all a statistical mirage as I’ve explained earlier. A placebo shot could easily produce a 90% VEdeath efficacy. Not a single published study which claims VEdeath >0 for the COVID shots has ever normalized for the healthy vaccinee effect (HVE) properly by measuring non-COVID ACM differences during low-COVID periods. All the studies are flawed. The Czech data clearly shows there was no benefit. I recently computed the case fatality rate ratio during Delta and Omicron between vaccinated and unvaccinated and found it was nearly identical to the non-COVID mortality differences of the cohort. The shots didn’t work.
Epidemiologists will avoid this data like the plague if they want to keep their jobs, just like they avoid looking at the Czech record level data.
It may take decades, like it did for smoking and lung cancer, for this harm signal to be accepted by the medical community. Doctors don’t want to lose their license to practice medicine and epidemiologists don’t want to be fired.