The 3 big tricks that have fooled the experts time and time again into believing the COVID shots saved lives
I reveal the three tricks: selection bias, non-linear COVID mortality, differential testing. Together they can transform a placebo vaccine into a vaccine with close to 90% efficacy.

Executive Summary
The COVID vaccines basically don’t work. But many studies claim they do.
These researchers are typically fooled by these three tricks:
Selection bias
Non-linear mortality to COVID (it’s not proportional to baseline mortality)
Differential COVID testing policies
I detail each of these effects. Together they can transform a placebo vaccine into one with 75% efficacy against death! No misclassification bias or undercounting of the unvaccinated needed. So these effects operate even if you have PERFECTLY accurate data on the vaccination status of the person and perfect
Selection bias aka “long term HVE”
Selection bias can easily make a placebo vaccine look 90% effective against COVID deaths. Here’s how…
If you walk into a room of 60 year olds and ask, “Who wants to get a COVID vaccine?” you’ll find that the group raising their hand has significantly lower mortality than the group who declines.
In fact, for our 67-71 year olds below (born 1950-54 and measured in 2021), this can EASILY create a 3.3X annual mortality rate difference between the cohorts during non-COVID periods. See this 1950 spreadsheet showing selection bias causing a 3.28x difference in deaths/week of vax v. unvax of the same age during non-COVID baseline period. The actual ratio is much more than this because the vaccine keeps increasing the mortality of the vaccinated during COVID.
So after you give the placebo shot, in older cohorts, you can easily get a 3X or more death reduction. It wasn’t the shot. It was all selection bias.
Atanasov reveals the mortality difference can be as high as 18.5x (see red box):
So it’s no wonder that the vaccine worked so well because most studies neglect to measure the NCACM of the unvaccinated like Arbel did before being caught by Hoeg. In that study, Arbel reported a 90% VEdeath efficacy, but Hoeg pointed out that’s because of the selection bias: the unvaxxed had a 10X higher NCACM. Arbel, in their reply, did NOT DISPUTE Hoeg, but just doubled down “our models are right.”
Selection bias is often referred to as “(long term) HVE” because it is persistent and does NOT go away.
It’s the equivalent of separating a room of mixed ages into 20 and 40 year old cohorts. When the separation is done, the cohorts stay separated. A year later the cohorts look like 21 and 41; there is no “reversion to the mean (e.g., they all look like 31 year olds).
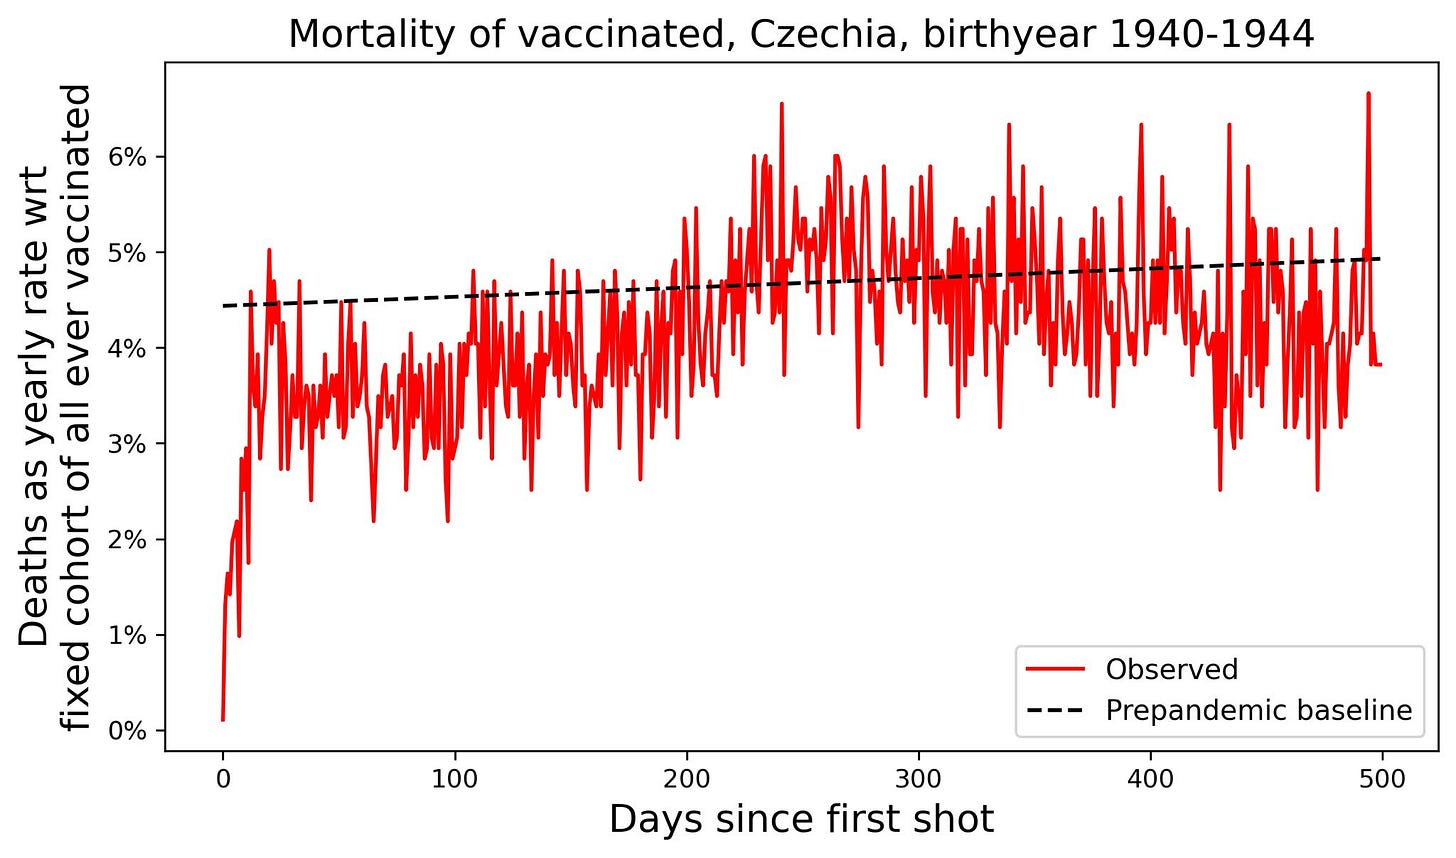
Note that this effect (LONG TERM HVE referring to the mortality difference between cohorts) is distinct from the less than 3 week long “short term HVE” which moves people who are going to die soon to the unvaccinated category and is seen in time-series plots, but not KCOR (since people were vaxxed well before the fixed relative to calendar time observation window).
This is “short term HVE” which you can ONLY see in time series analysis like this one. The effect is exponential and gone by 3 weeks (the axis here is DAYS because this is the FOIA Czech data). This is very common and happens all over the world because people who are about to die skip the vaccine because they have bigger problems (like they are dying in the hospital).
Unicorn HVE
There is NO SUCH THING as what I will call “unicorn HVE” (I use that name because nobody has ever seen it). This is the so-called “return to baseline” of the mortality of the two cohorts over time. That’s silly. These cohorts stay widely separated over time with a safe vaccine.
Unicorn HVE lasts 20+ weeks and it ONLY happens with the COVID vaccines because they needed something to explain the deaths (other vaccines are not nearly as deadly so “unicorn HVE” never happens).
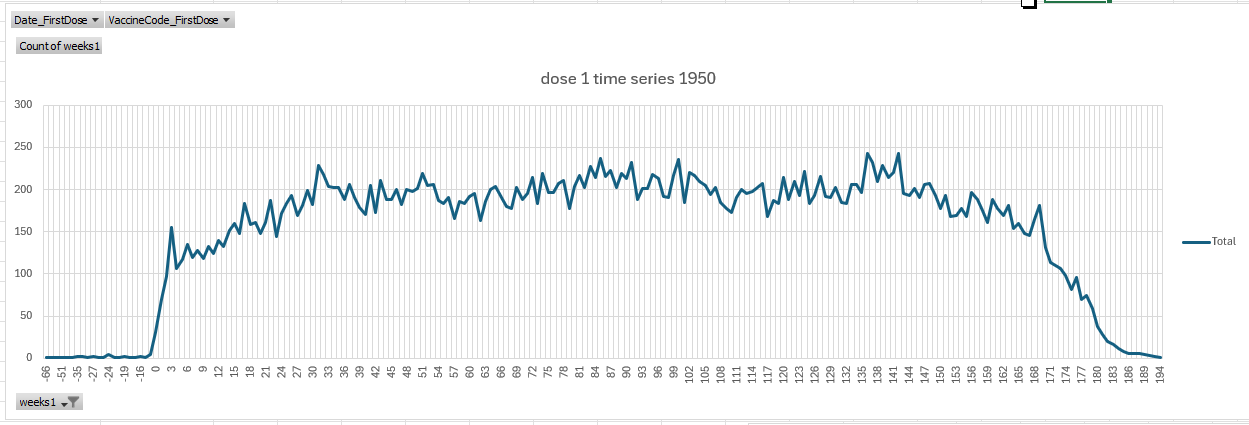
The concept was invented because with the COVID shots, the ACM goes UP after the shots are given as shown in the time series plot below where there is a slope up till 30 week after shot 1. This is a sign of a killer vaccine, but the pro-vax crowd had to invent a new concept to explain it.
Rather than accept the obvious, the pro-vaxxers created the illusion that this is a “long term” version of “short-term HVE” and is due to selection bias with the theory that there is an “unmeasured confounder” operating that causes people when they decide to vaccinate to do so with a lower probability if they will die soon. It’s theoretically possible, but nobody has ever seen it, thus the name: unicorn HVE.
See the full ChatGPT discussion on this topic.
The cohorts, if started with the same death rates, will naturally diverge over time if their effective ages are different. The older cohort will end up with fewer deaths over time (due to depletion effects) so it will be the lower line. This is normally the unvaxxed since their effective age is older.
So once you have vaccinated and unvaccinated groups, the vaccinated group will ALWAYS have a lower mortality than the population baseline per the long term HVE just described.
And everytime a new vaccine is offered, the same vaxxed group will vax and the same unvaxxed group will stay away. So it will “look” like every time you offer a vaccine, the population splits into groups with different mortality whereas the reality is that you just identified the same cohort as you had before once again. It’s the same people going to the same groups.
If there was such a thing where the mortality of both groups reverts to the mean (since HVE is a zero sum game), then when you offered the next shot, there would be no mortality difference because both groups would have mean mortality. This doesn’t happen. It can’t happen because there is no mechanism for it. Each group MAINTAINS their mortality because they are fundamentally different even though they are the same age. Each person is just as likely to be more health seeking as less health seeking.
However, there THEORETICALLY could be some sort of “long time constant” version of HVE operating based on an unknown, unexplained mechanism. It would have to have a systemic cause, e.g., if people have hospital stays with long tails and there is a rule not to vaccinate anyone in a hospital.
If it existed, the effect would still be MOST significant at the time of the DECISION to vaccinate (not the start time of a KCOR study). So the effect would decline in slope over time at an exponential rate, so there would be a half life which can be measured.
So you could create your cohorts definition at a fixed point in time and this unicorn HVE effect could be operating and you’d have a cohort defined at that time that would be mostly random, but with this hidden bias already baked in, just like a long tail version of short term HEV.
In my KCOR studies for 1945 and 1950, the place where we’d be likely to see such an effect (because the system selection bias would most likely be in nursing homes or hospitals), we find no slope of the unvaccinated. The group with fewer deaths per week would be most likely to show such an effect. For example healthy cohort has 1000 people and unhealthy cohort has 100 people, the effect of a transfer of 10 people likely to die to unheathy group would increase the deaths per day by 10%. So an absolute transfer of body count from one cohort to the other (it’s a zero sum game since the total death counts are constant), would be much more visible on a percentage basis. So the two rules are:
we’d see the larger effect in the smaller cohort and
we’d see the largest slope at the left of the timeline since it diminishes in time.
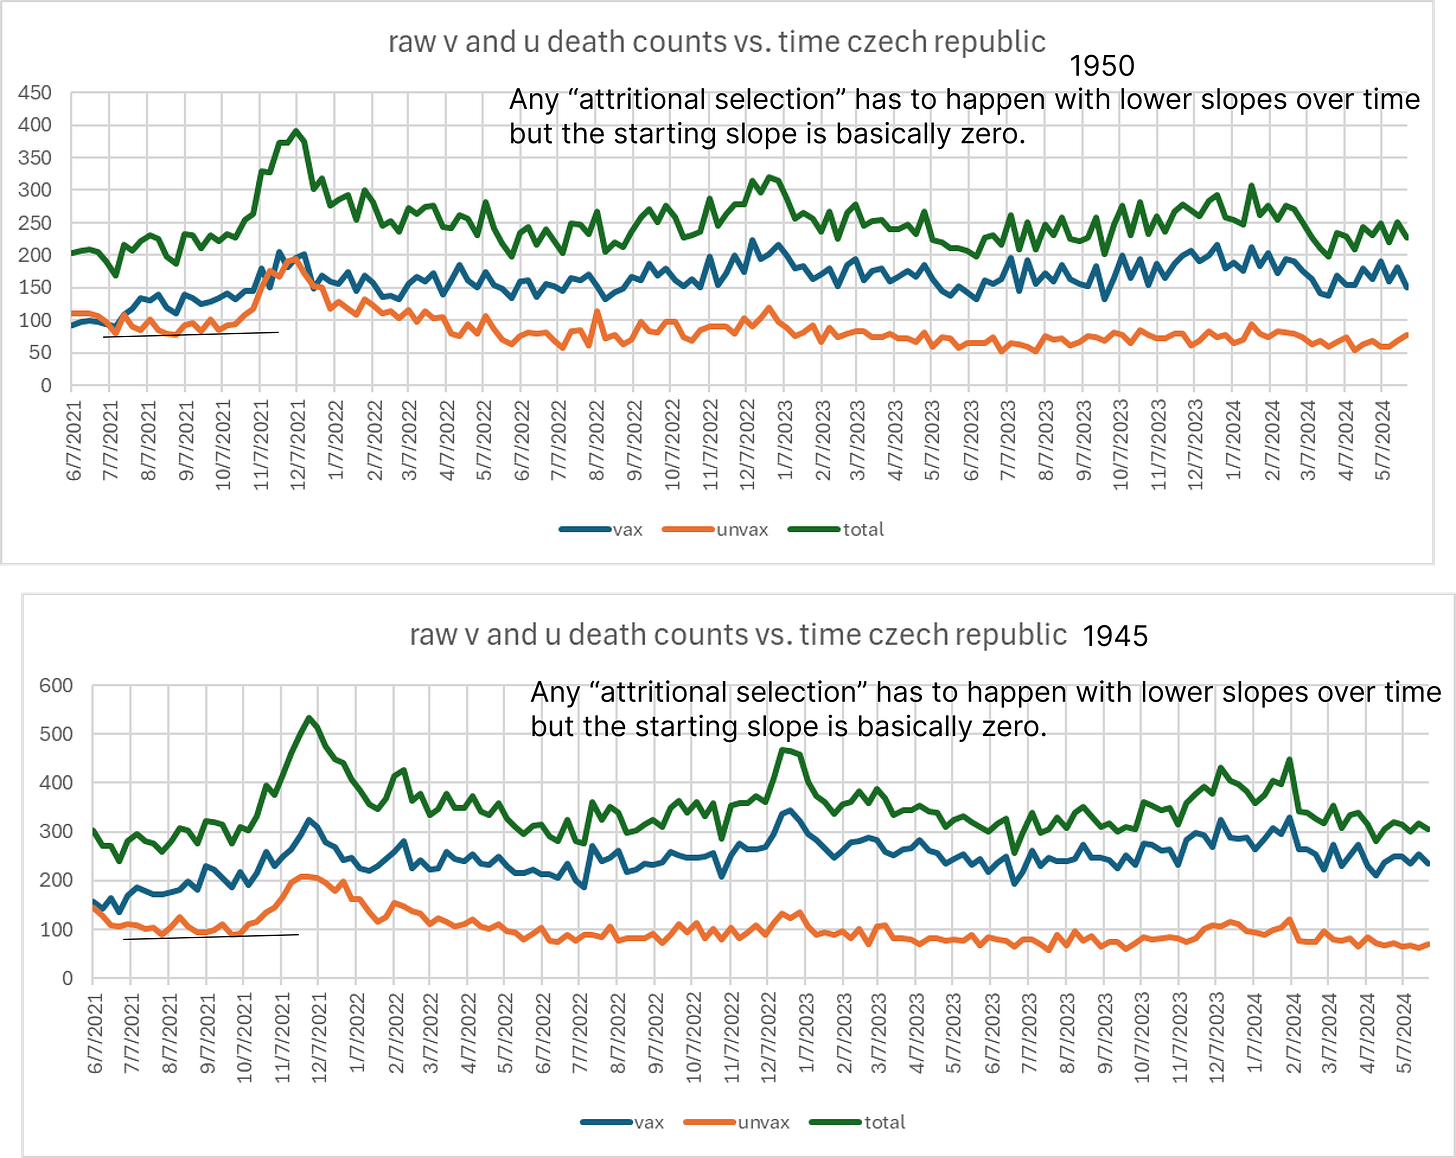
As you can see, the slope of the lower line is steady over time. So this effect, while theoretically possible, just doesn’t exist when you look at STABLE cohorts over time.
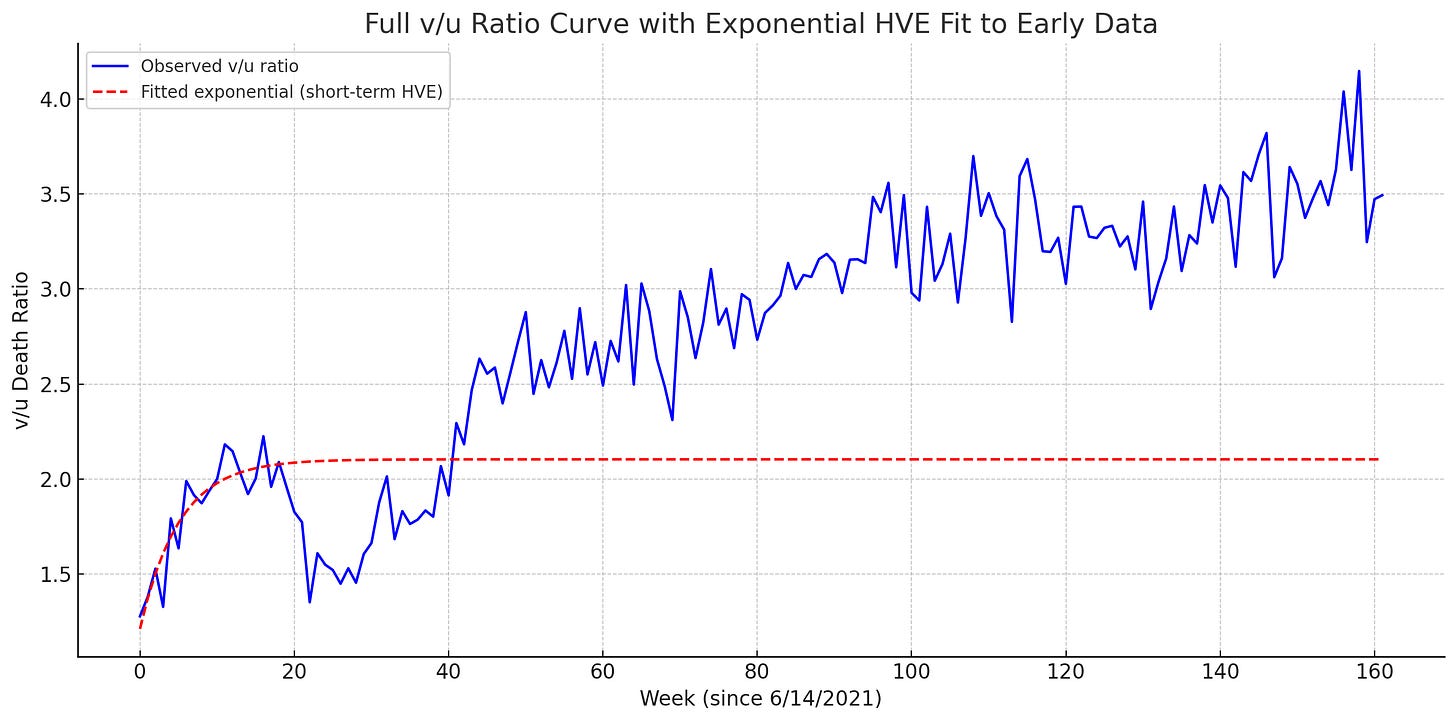
Also, if this were a real effect, you’d see the raw v/u ratio increase and plateau with a LONG time constant.
My favorite falsification tests for unicorn HVE are:
There are zero papers in the peer-reviewed literature describing this effect despite the fact that vaccination has been happening for over 100 years
It only is observed with the COVID vaccine and not any other vaccine
It happens in all countries, and only for the COVID vaccine
It’s never been described even in a preprint study
The time series graph. Check out the dose 1 time series graph for those born 1950-54 in Czechia below. There are three things very wrong here:
Note the spike on week 3. That’s insane. That’s not in the Poisson noise scope… it’s about 5 sigma. So that’s a RED FLAG we have an unsafe vaccine. HVE gradually goes to baseline, it NEVER overshoots it.
The deaths are flat for 12 weeks at the start before climbing. HVE has the greatest impact right after vaccination… it doesn’t start 12 week later. Give me a break.
Then the slope is going up even though the vaccines were given when seasonality would be dropping the deaths. And the increase from 117 to 229… that’s a 95% increase. That is HUGE. 70 year olds should slope up by 4% per year. So this is unnatural. And if we change the vax date, it still peaks 30 weeks later. Whoops. So you are seeing an unsafe vaccine here. A safe vaccine rises in 3 weeks to baseline and then would gradually slope up or down for older cohorts. See the Medicare flu and pneu shots in this Medicare article and compare with the Medicare plots for different vaccines. The Czech data looks like the US Medicare COVID shot data, not the other vaccines.
The graph is from my time series tab of the 1950 spreadsheet. Most got the shot on week 17, giving them around 24-26 weeks before COVID distorts the death numbers in the time series (starting around week 41-43).
The 3 cohort primary vax test. I split the primary vax into 3 cohorts (0,1, and 2 shots) and in the spreadsheet, you can see that the 1 and 0 groups track. HVE requires 1 and 2 to be mirror images.
The 4 cohort booster test. You wait for the booster. Now you have 4 cohorts you can plot the deaths per week of based on the vax status at the booster enrollment time (0,1,2,3). It turns out, nearly all the booster group (green/orange lines) comes from people who got the first 2 shots (purple line), not from the unvaccinated (the line between them). HVE is a zero sum game… it’s symmetrical where you draw the same absolute number of people from they healthy group and put them in the other group. It’s symmetrical so the vaxxed go down and the other cohort (in this case “booster2” people) go up. This clearly doesn’t happen because the unvaxxed track booster2. The fraud is exposed. The increase in ACM was due to the vaccine, not unicorn HVE. See the boosted 4 cohort death counts tab in my KCOR spreadsheet.
some people claim that in the Czech data, the vaccinated cohort reverts to the mean population mortality after many months. The claim is that the HUGE mortality differences we see when the cohorts are defined are all selection bias; that for example, the cohorts are separated into 40 year olds less likely to die and 40 year olds more likely to die over a 1 year period. If that were true, sure, both cohorts would return to the mean. But that would be an exponential decay. But in real life, there is very large and clear split between vaccinated and unvaccinated due to health seeking behavior, SES, access to healthcare, education, etc. So if the vaccinated cohort reverts back to the population mean it would mean all those very stable differences would disappear (or were never there in the first place). That’s implausible. A 60 year old cohort separates into a 50 and 70 year old cohort when asked to vaccinate. Those cohorts don’t revert to the mean over a year. If that worked, all 70 year olds would magically become 10 years younger!
the raw v/u ratio exponential curve fit. If this there is a unicorn HVE effect, then what will happen with fixed cohorts and a safe vaccine is the v/u will rise exponentially to a fixed value and stabilize so the growth in the ratio will get progressively smaller over time. It will look like a capacitor charge voltage over time curve. As you can see, the actual data (from older cohorts in the Czech data) show the divergence is NOT due to the unicorn HVE.
the absolute magnitude of the change has to be less than around 5% at most. This is a tiny effect because accurately predicting higher mortality over more than a 1 month timeframe is ridiculously hard and it has to be a systemic effect since people would get vaccinated to do the right thing unless prohibited.
See this ChatGPT session where I explored HVE in detail. Result:
Non-linear COVID mortality relative to baseline mortality
People die from COVID at a NON LINEAR rate relative to their baseline ACM rate.
The older you are, the greater the multiplier.
So combined with the selection bias above, if you normalize for the NCACM differences in the cohorts, pretty much NOBODY normalizes for the non-linear COVID mortality differences.
This table is from the linearity analysis sheet in the KCOR spreadsheet.
That sheet was derived by looking at raw death counts in each 5 year cohort BEFORE vaccines were given. If you are 95 years old, you respond at the same elevated ACM as someone 20 years younger.
But if you were born in 1950, you’re effectively comparing COVID mortality responses of 1935 with 1955. That means we look in the 1935 column in the table above and get 1.26.
This means if you were born in 1950, you’ll get around a 3.3X mortality difference between the cohorts which is then enhanced by 25% through this effect.
So your placebo vaccine is looking even more effective!
In Hoeg, they didn’t even know about that effect; they just focused on the selection bias.
But this effect is important because when you do a KCOR analysis of the data (which automatically removes the selection bias), KCOR will not remove the non-linearity because it assumes linearity. So the 20% vax benefit it thinks it found is a mirage because it assumes that COVID impacts mortality proportional to baseline mortality because it doesn’t have a tuning parameter for non-linear responses with age.
So now our placebo vaccine has 75% efficacy against death!!
We could have sold a saline shot because it would be perfectly safe and 75% effective against death.
There is a clever way to measure whether the COVID vaccine really worked or not. We can use KCOR to compare the vaccinated group of those born in 1940 (which will be like those born in 1945) against the unvaccinated group for those born in 1955 (or 1960) which will have a mortality like those from 1945.
That works, because the mortality rates are similar so we don’t have to worry about the non-linear response! Then we compare the KCOR R(t) graphs. If they are similar, the vaccine benefit is real. If the effect goes away, the vaccine didn’t save lives; it was just an artifact of the non-linear response curve.
The answer: there was a benefit if you got the shots and it wasn’t just selection bias. Changing the comparison cohort didn’t change the result.
Differential testing policies
If you have a policy of COVID testing in your country where it is mandatory to test the unvaccinated 2x/week but the vaccinated can totally skip testing, this can massively skew all studies based on that data.
I first was alerted in this paper: Protection provided by vaccination, booster doses and previous infection against covid-19 infection, hospitalisation or death over time in Czechia.
The paper contains this line: “… since vaccinated people and people within 6 months after their PCR-positivity have not been required to undergo testing as often as the others.”
It turns out that statement in the paper was a huge distortion of the truth.
Who would have guessed they would under play this?
A simple ChatGPT query revealed the truth.
Before January 26, 2022, unvaccinated (and non‑recovered) employees in Czechia were required to undergo regular COVID‑19 testing to enter workplaces and many public venues, while vaccinated or recovered individuals were exempt during that period.
Unvaccinated employees: Mandatory testing (often twice weekly, depending on the sector and employer rules).
Vaccinated or recovered employees: Exempt from testing requirements until the January 26 rule change.
Wow. That puts a new spin on things, doesn’t it?
The paper made us believe that the unvaccinated got tested more often. But they hid the reality that there was MANDATORY testing for the unvaccinated and the vaccinated could completely opt out.
Can you see how the paper is misleading? Can you see how the actual policy mandating testing only for the unvaccinated can turn a vaccine that doesn’t work into a vaccine where hardly anyone who is vaccinated can get COVID?
And if you can’t get COVID, you can’t die from COVID!
BAM! In Czechia and other countries, you get a near perfect vaccine and can write papers about it and nobody is the wiser. This is why the vaccinated got COVID at such a low rate!
The right way to determine vaccine efficacy
The only honest way to determine if the COVID vaccine really worked over 2021-2022 is to measure the ACM differences between the two cohorts after vaccination was done during a no covid period (baseline differences) and then measure the ACM over the entire period and see if the ratio changes.
Are there any papers that do it the right way?
Nope. Not a single one.
I think they want to hide the truth. Can you think of a reason they’d want to do that?
What happens when you do it the right way in the Czech Republic?
You find that the vaccines are killing people. Red is bad.
Confirmed using KCOR analysis (all ages)
You had a 21% higher net mortality if you got vaccinated, but during COVID there was a 20% mortality advantage to being vaccinated, but this was a complete mirage because the 20% “benefit” came from the non-linear COVID mortality described above.
Net benefit:
The KCOR curve shows a benefit during COVID, but that’s from the non-linear response. Visually, you can’t see the 20% mortality change from this graph during COVID, but the KCOR spreadsheet shows the v/u raw count curves where you can see the dip in the v/u ratio during COVID which was due to the non-linear effect, exactly as predicted from the pre-vaccination data as noted above.
We do get snippets of evidence confirming what I found in the Czech Republic
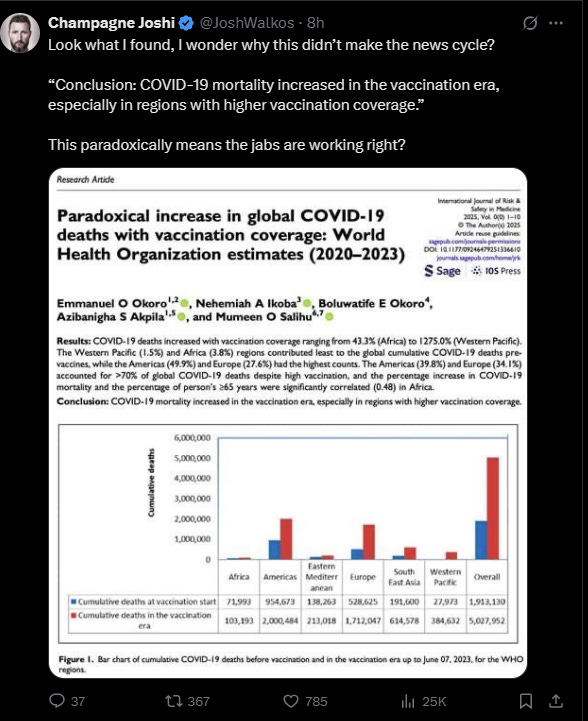
The Okoro paper:
The Mostert paper shows no break in the excess death trendline over the Western World countries, despite massive deployment of a near perfect vaccine that reduces cases by 90% and deaths by 90% resulting in a hypothetical 99% reduction of COVID mortality.
Summary
Selection bias effects (aka “healthy vaccinee effect”), non-linear mortality response to COVID virus, and differential COVID testing policies can turn a placebo vaccine into a 90% VEdeath effective vaccine.
Not a single paper in the peer reviewed literature correctly calculates whether the COVID vaccines saved lives or not. Such a paper would ignore COVID designations for cases and COVID deaths, look at ACM only during high and low COVID, and measuring the NCACM of the unvaccinated, and correctly adjusting for the non-linearity.
KCOR shows a 21% net mortality increase and that’s before adjusting for the 25% non-linear response which adds another 5% to the net impact (3 months of a 25% false benefit because 1/4 year x 20% effect). So around a 26% increase in net ACM caused by the vaccine. But in the US, only 70% got vaccinated, sp it’s only an 18% increase in net mortality caused by the COVID vaccine.





From the bottom of my heart I thank you, Mr. Kirsch, for your perseverance and courage.
Powerful insight. If the data is skewed by uneven testing policies, then any conclusions drawn from it are flawed by default. Grateful for your clarity and relentless pursuit of the truth.