
What happens if we apply KCOR to financial markets?
A quantitative equity strategy derived from the KCOR research done over the past 6 months.


A Quantitative Equity Strategy Derived from KCOR Research
(For informational purposes only)
Over the past 6 months, I developed a novel statistical framework (KCOR) for analyzing large retrospective datasets. While the original application was in epidemiological research, I later discovered that the same mathematical structure could be applied to financial markets.
This post describes a quantitative, fully systematic equity strategy derived from that work and presents historical backtest results generated using publicly available U.S. equity data.
This discussion is educational and informational only. Nothing in this post constitutes investment advice, an offer to sell securities, or a solicitation to purchase securities.
Strategy overview
The strategy has the following characteristics:
Fully algorithmic; no discretionary judgment
The algorithm is exactly the same over the entire period
Long-only
Trades only U.S. large-cap public equities
No leverage
Low turnover, designed for tax efficiency
Two tunable parameters with broad parameter stability
All gains are long term capital gains
The approach is based on persistent structural features of market data rather than short-term signals.
Historical backtest results (2000–2025)
The results below reflect a hypothetical backtest covering the 25-year period from January 2000 through October 2025.
Key points:
These results are not audited
They reflect hypothetical performance
They include assumptions that may not hold in live trading
Past performance does not predict future results
Summary statistics (hypothetical backtest results over 25 years)
The strategy experienced substantial drawdowns during major market dislocations (e.g., 2000–2002, 2008), and investors would have needed the ability to tolerate significant volatility and extended recovery periods.
Detailed tables of hypothetical returns, drawdowns, and trade statistics are provided below for transparency.
Generated: 2025-11-18 14:34:17
============================================================
CONFIGURATION PARAMETERS
============================================================
List Name:               sp500_and_ndx
Analysis Period:         2000-01-03 to 2025-10-07
Portfolio Size:          xx stocks per portfolio
Screening Lookback:      yy months
Rebalancing Period:      366 days (for tax efficiency)
Initial Investment:      $1,000 per stock
Algorithm:               Czech mortality
Strategy:                LONG
Parallel Portfolios:     26
Entry Offset:            14 day(s)
Total Investment:        $260,000

============================================================
PORTFOLIO PERFORMANCE SUMMARY
============================================================
Initial Portfolio Value: $260,000.00
Final Portfolio Value:   $145,633,323.92
Dividends Collected:     $2,753,689.09
Dividend Return:         1059.11%
Total Return:            49760.80%
Annualized Return (TWR): 28.69%
Net Annualized Return:   27.32%
Money-Weighted Return:   28.65%
Total Management Fees:   $7,847,224.33
Total Performance Fees:  $26,647,833.46
Annualized Volatility:   36.58%
Sharpe Ratio:            0.75
Maximum Drawdown:        -70.91%
Number of Trading Days:  6480

MONTHLY RETURNS STATISTICS:
Best Month:              41.03%
Worst Month:             -29.08%
Average Monthly Return:  2.45%
Monthly Volatility:      9.33%

ANNUAL RETURNS:
Year 2000: -29.15%
Year 2001: 11.45%
Year 2002: -5.73%
Year 2003: 87.07%
Year 2004: 70.50%
Year 2005: 56.14%
Year 2006: 25.63%
Year 2007: 72.36%
Year 2008: -59.74%
Year 2009: 47.71%
Year 2010: 40.72%
Year 2011: -1.06%
Year 2012: 46.33%
Year 2013: 54.34%
Year 2014: 25.08%
Year 2015: 5.73%
Year 2016: 19.26%
Year 2017: 29.48%
Year 2018: 9.21%
Year 2019: 36.48%
Year 2020: 124.35%
Year 2021: 22.44%
Year 2022: -2.75%
Year 2023: 25.81%
Year 2024: 120.31%
Year 2025: 47.40%

============================================================
PER-PORTFOLIO PERFORMANCE
============================================================
Ranked Portfolios (by annualized return):
 1. Portfolio 14: Ending Equity $16,686,008.96 | Annualized Return 34.32% | Mgmt Fees $970,623.52 | Perf Fees $3,657,218.94
 2. Portfolio 15: Ending Equity $15,798,603.58 | Annualized Return 34.09% | Mgmt Fees $862,538.76 | Perf Fees $3,509,460.04
 3. Portfolio 16: Ending Equity $13,932,361.21 | Annualized Return 33.48% | Mgmt Fees $695,019.59 | Perf Fees $2,767,427.21
 4. Portfolio 11: Ending Equity $12,396,939.61 | Annualized Return 32.58% | Mgmt Fees $714,062.55 | Perf Fees $2,186,955.89
 5. Portfolio 12: Ending Equity $10,763,076.08 | Annualized Return 31.89% | Mgmt Fees $596,153.43 | Perf Fees $1,950,354.07
 6. Portfolio 13: Ending Equity $10,333,640.36 | Annualized Return 31.74% | Mgmt Fees $618,502.03 | Perf Fees $2,050,079.31
 7. Portfolio 18: Ending Equity $7,883,281.44 | Annualized Return 30.60% | Mgmt Fees $422,537.31 | Perf Fees $1,729,078.65
 8. Portfolio 20: Ending Equity $6,870,259.33 | Annualized Return 29.99% | Mgmt Fees $218,377.07 | Perf Fees $598,574.95
 9. Portfolio 10: Ending Equity $6,371,236.77 | Annualized Return 29.09% | Mgmt Fees $373,014.75 | Perf Fees $1,027,489.12
10. Portfolio 17: Ending Equity $5,724,002.70 | Annualized Return 28.89% | Mgmt Fees $329,654.15 | Perf Fees $1,162,117.12
11. Portfolio 19: Ending Equity $5,442,591.59 | Annualized Return 28.73% | Mgmt Fees $289,113.01 | Perf Fees $1,222,257.08
12. Portfolio 21: Ending Equity $4,861,222.69 | Annualized Return 28.25% | Mgmt Fees $191,383.92 | Perf Fees $536,369.85
13. Portfolio 26: Ending Equity $4,538,988.39 | Annualized Return 28.15% | Mgmt Fees $194,748.67 | Perf Fees $604,779.97
14. Portfolio 22: Ending Equity $3,421,109.94 | Annualized Return 26.50% | Mgmt Fees $208,121.31 | Perf Fees $511,352.87
15. Portfolio 23: Ending Equity $3,060,476.78 | Annualized Return 25.99% | Mgmt Fees $189,271.21 | Perf Fees $471,834.16
16. Portfolio 25: Ending Equity $2,629,487.09 | Annualized Return 25.31% | Mgmt Fees $145,394.19 | Perf Fees $438,595.44
17. Portfolio 24: Ending Equity $2,454,320.67 | Annualized Return 24.92% | Mgmt Fees $135,356.52 | Perf Fees $410,138.89
18. Portfolio 9: Ending Equity $2,483,211.30 | Annualized Return 24.34% | Mgmt Fees $174,227.29 | Perf Fees $403,592.63
19. Portfolio 3: Ending Equity $2,088,427.23 | Annualized Return 23.26% | Mgmt Fees $111,372.88 | Perf Fees $352,847.50
20. Portfolio 8: Ending Equity $1,617,556.10 | Annualized Return 22.22% | Mgmt Fees $92,753.79 | Perf Fees $224,593.62
21. Portfolio 2: Ending Equity $1,369,575.85 | Annualized Return 21.22% | Mgmt Fees $65,908.46 | Perf Fees $215,398.37
22. Portfolio 1: Ending Equity $1,183,295.30 | Annualized Return 20.49% | Mgmt Fees $54,389.64 | Perf Fees $175,374.88
23. Portfolio 4: Ending Equity $1,093,105.23 | Annualized Return 20.22% | Mgmt Fees $52,335.17 | Perf Fees $128,906.01
24. Portfolio 7: Ending Equity $1,037,286.02 | Annualized Return 20.07% | Mgmt Fees $56,140.34 | Perf Fees $124,481.97
25. Portfolio 6: Ending Equity $801,809.41 | Annualized Return 18.83% | Mgmt Fees $45,325.17 | Perf Fees $94,218.16
26. Portfolio 5: Ending Equity $791,450.30 | Annualized Return 18.74% | Mgmt Fees $40,899.59 | Perf Fees $94,336.78
Average Annualized Return (across 26): 26.69%

============================================================
TRADE PERFORMANCE ANALYSIS
============================================================
Total Completed Trades:  6,052
Winning Trades:          4,232
Losing Trades:           1,817
Breakeven Trades:        3
Win Rate:                69.9%
Average Win Amount:      $34,460.23
Average Loss Amount:     $-7,815.37
Average Win Percentage:  111.0%
Average Loss Percentage: -28.4%
Largest Win:             $3,878,087.96
Largest Loss:            $-196,895.98
Profit Factor:           10.27
Avg Holding Period:      435 days
Avg Holding (Winners):   452 days
Avg Holding (Losers):    394 days
Risk-Reward Ratio:       4.41:1
Trade Expectancy:        $21746.82

============================================================
TAX IMPLICATIONS SUMMARY
============================================================
Total Realized Gains:    $131,635,176.49
Long-term Gains (≥1yr):  $131,635,176.49
Short-term Gains (<1yr): $0.00
Long-term Percentage:    100.0%
Note: Long-term gains typically taxed at lower rates (0%, 15%, or 20%)
      Short-term gains taxed as ordinary income
[INFO] Long positions opened: 5676
[INFO] Long positions closed: 6052
[INFO] Total open amount: $325,197,006.13
[INFO] Total close amount: $340,246,619.91
[INFO] Long-term sells: 6052 ($340,246,619.91)
[INFO] Short-term sells: 0 ($0.00)
[INFO] Average holding period: 435 days
AI-generated commentary on hypothetical backtest results
For readers interested in an informal, AI-generated discussion of how results of this magnitude compare—at a high level—to commonly known long-only investment strategies, a separate commentary is available here.
This commentary is AI-generated, reflects no independent verification, and should not be interpreted as an endorsement, validation, or investment advice.
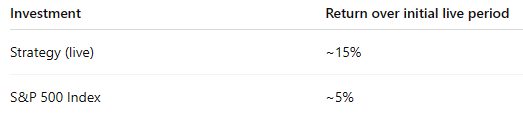
Live trading results (preliminary)
The strategy has been implemented in live trading beginning in late 2025. Over the initial operating period to date, the strategy has generated positive returns.
This live track record is short in duration and should not be interpreted as statistically conclusive, predictive, or as validation of the historical backtest.
All Live trading was conducted under the same rules as the historical backtest.
Important risk considerations
This strategy is highly volatile
Large drawdowns are possible
There is no guarantee that historical relationships will persist
Liquidity assumptions may fail under stressed market conditions
The strategy may underperform the broader market for extended periods
This strategy is not suitable for most investors.
Information for accredited and qualified investors
Kirsch Capital is exploring interest from investors who meet the SEC definitions of Accredited Investor, Qualified Client, or Qualified Purchaser, as applicable under U.S. securities laws. This generally means you have a net worth of $2.2M or more.
Any potential investment would be offered only pursuant to an applicable exemption from registration, including Rule 506(c) of Regulation D, and only after verification of investor status.
Submitting an information request does not constitute an offer or acceptance of any investment.
If you believe you may qualify and would like to receive additional information, you may submit an investment interest form. Access to further materials, if any, will be provided only after appropriate qualification and verification.
Final note
This post is intended to describe research, methodology, and hypothetical results. It should not be relied upon as the basis for any investment decision.
© Kirsch Capital. All rights reserved.
Steve, have you seen the new study about covid jabs and cancer that big harma is having apoplexy over and trying to bury all over the internet? Here is info and abstract.
Oncotarget, 2026, Vol. 17, pp: 1-29
COVID vaccination and post-infection cancer signals: Evaluating patterns and potential biological mechanisms Charlotte Kuperwasser1,2 and Wafik S. El-Deiry3,4,5 1 Department of Developmental, Molecular and Chemical Biology, Tufts University School of Medicine, Boston, MA 02111, USA 2 Laboratory for the Convergence of Biomedical, Physical, and Engineering Sciences, Tufts University School of Medicine, Boston, MA 02111, USA 3 Laboratory of Translational Oncology and Experimental Cancer Therapeutics, Department of Pathology and Laboratory Medicine, The Warren Alpert Medical School of Brown University, Providence, RI 029121, USA 4 Hematology-Oncology Division, Department of Medicine, Brown University Health and The Warren Alpert Medical School of Brown University, Providence, RI 029121, USA 5 Legorreta Cancer Center at Brown University, The Warren Alpert Medical School of Brown University, Providence, RI 029121, USA Correspondence to: Charlotte Kuperwasser, email: charlotte.kuperwasser@tufts.edu Wafik S. El-Deiry, email: wafik@brown.edu Keywords: COVID; vaccine; cancer; infection; lymphoma; leukemia; sarcoma; carcinoma Received: November 26, 2025 Accepted: December 26, 2025 Published: January 03, 2026 Copyright: © 2026 Kuperwasser and El-Deiry. This is an open access article distributed under the terms of the Creative Commons Attribution License (CC BY 4.0), which permits unrestricted use, distribution, and reproduction in any medium, provided the original author and source are credited. ABSTRACT A growing number of peer-reviewed publications have reported diverse cancer types appearing in temporal association with COVID-19 vaccination or infection. To characterize the nature and scope of these reports, a systematic literature search from January 2020 to October 2025 was conducted based on specified eligibility criteria. A total of 69 publications met inclusion criteria: 66 article-level reports describing 333 patients across 27 countries, 2 retrospective population-level investigations (Italy: ~300,000 cohort, and Korea: ~8.4 million cohort) quantified cancer incidence and mortality trends among vaccinated populations, and one longitudinal analysis of ~1.3 million US miliary service members spanning the pre-pandemic through postpandemic periods. Most of the studies documented hematologic malignancies (nonHodgkin’s lymphomas, cutaneous lymphomas, leukemias), solid tumors (breast, lung, melanoma, sarcoma, pancreatic cancer, and glioblastoma), and virus-associated cancers (Kaposi and Merkel cell carcinoma). Across reports, several recurrent themes emerged: (1) unusually rapid progression, recurrence, or reactivation of preexisting indolent or controlled disease, (2) atypical or localized histopathologic findings, including involvement of vaccine injection sites or regional lymph nodes, and (3) proposed immunologic links between acute infection or vaccination and tumor dormancy, immune escape, or microenvironmental shifts. The predominance of caselevel observations and early population-level data demonstrates an early phase of potential safety-signal detection. These findings underscore the need for rigorous epidemiologic, longitudinal, clinical, histopathological, forensic, and mechanistic studies to assess whether and under what conditions COVID-19 vaccination or infection may be linked with cancer.
STEVE THANK YOU FOR BEING SO INVENTIVE IN FINDING NEW WAYS TO PROVE A POINT. WELL ABOVE BIG PHARMAS CAPERBILITIES. ALL THEY DO IS FIDDLE THE FIGURES AND EARN $BILLIONS IN DOING SO. ALSO COVERUPS INCLUDED.