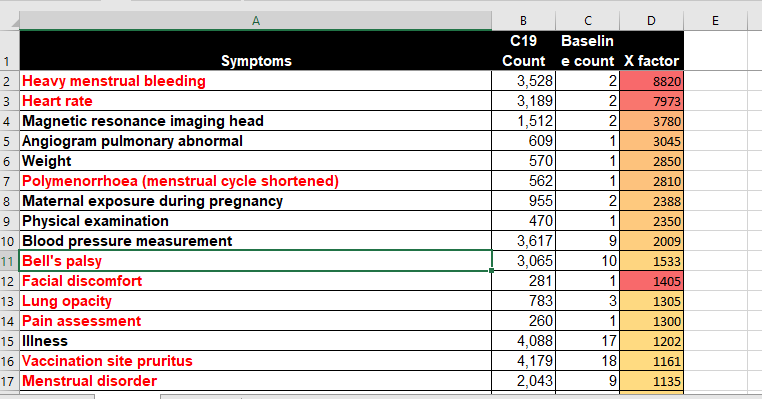
The VAERS X-factor analysis
Albert Benavides did an analysis of the VAERS data to find which symptoms were the most strongly elevated vs. baseline. Here's what he found.
This is Part 2 of the VAERS X-factor analysis (the first part was New VAERS analysis reveals hundreds of serious adverse events that the CDC and FDA never told us about).
NOTE
I’m trying to increase the number of paying subscribers I have as this supports the substack community and our efforts. All proceeds I get will go to paying the salaries of people working for the Vaccine Safety Research Foundation (vacsafety.org) as well as buying ads so we can get the message out.
This article contains:
The complete spreadsheet of all VAERS symptoms with X-factor analysis sorted by X-factor
Albert’s analysis of the data (PDF format)


