Can you spot the unsafe vaccine?
I'm going to show you the mortality curve of two vaccines. See if you tell which one is not safe. You can answer even if you aren't a doctor.
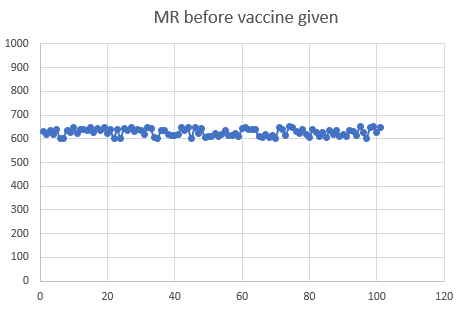
Control
This is the mortality rate in the 100 weeks before the vaccine was given:
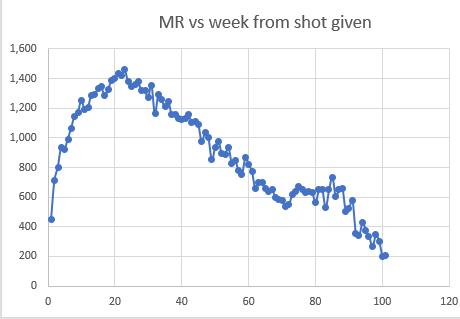
Vaccine A
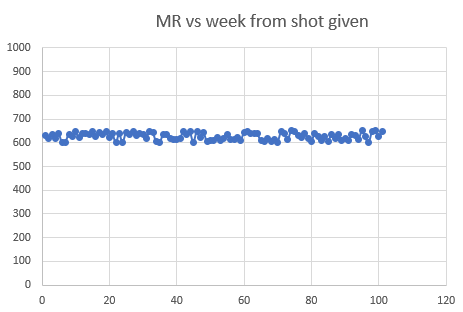
Vaccine B
The y-axis is the MR is the mortality rate in deaths per 100K person years.
The x-axis is the week since the shot was given.
The curves are an average for all doses, and all ages, over all time periods.
It’s tough. Take your time on this one.
P.S. If you answered “They look the same” you can get a job at the CDC or FDA in product safety in a heartbeat. They are looking for people like you!


Does anyone have the power point with the excel file for the NZ data? I need it to remake our powerpoint.
Long time Steve Kirsch fan and follower here - Can anyone of you wonderful people point me to a chart of VAERS with top reported reactions to jab? There are so many posts I should keep better track of data so I can find it readily! Just curious if anyone has it handy. A friend of mine’s mom has gotten 4 jabs + shingles + flu and she’s covered in painful water blisters I know this is a common side effect I just want to show a chart to show how common this awful (luckily not life threatening) side effect is! Thanks in advance!!